Tuesday, September 1, 2015

How to Add Charts, Graphs and Visualization to a Blog Post

Over last few months, I have written few blog posts where I used pretty sophisticated Charts, Graphs and Visualization. They make the blog post lot more meaningful and readable, readers love those charts, tables & displays. In this post, I will share the service I use for those visuals and few quick steps on how to create a chart and add that to your blog.

I use the services of http://www.StatsPanda.com, it's in public beta and it's free for "Individual" users.

StatsPanda.com Home Page


Once you login using your Facebook account, it redirects to registration page and during registration it gives two options - "Individual" and "Enterprise". Choose "Individual".

Go to API Console. I will suggest that you spend some time exploring the listed Visualization APIs. You may have to spend some time trying out the APIs in order to understand the JSON Inputs structures. It's not super complicated, although it may take some time. Initially you can use the example input data provided along with API Documentation.

API Console to create Charts, Graphs etc


Once decided, go ahead and create the Chart of your choice and that would give you a unique url and iFrame Code for your chart. For this blog I created a Stacked Area Chart with the example data that API Console provided. In the above screenshot, you can see a greyed out box right below the chart. The content of that box is copied below for your reference. You can straight away use that in your blog.

<iframe src="http://www.statspanda.com/charts/ui/nvd3/stacked-area-chart?unique_key=dc27b99e933da8969218fb3d8e06aeafdc61e170dad7c5aed1b5d41381b2d8" style="border: #E8E8E8 1px solid; height: 300px; width: 100%;"></iframe>

Here is an example how the Visualisation really appears in a blog once you include the iFrame code snippet to your blog.


The chart is dynamic and not a jpg pic, data is being served from the Website. In fact, if you want you can "Edit" the input JSON Data and have a different chart of same type.

Hopefully you find it useful and able to use the charts and graphs in your blogs.


Wednesday, August 5, 2015

Top 10 Machine Learning Libraries and Services for Java Developers

In recent times, Machine Learning has emerged as one of the most talked about topics in the field of information science and technology. Although the subject has probably intrigued the researchers and academicians for decades, it's only now every Software Engineer is trying to get a hang of it. It's changing the face of computing for ever and in a way, accelerating the move from Software Eating The World to Software Eating Software. 

In this blog, I will cover (rather list out) some of the top Machine Learning libraries and services available for a Java developer and try to highlight some of the salient points associated with each of those libraries. Please note some of the most powerful machine learning libraries are in Python and they are not covered in this post at all.

Before I go to the list of libraries, here is a short list of algorithms or broad categories of problems that most of the Machine Learning libraries would cover either fully or partially -

  • Classification
  • Regression
  • Clustering
  • Ranking

Here are few examples of application:
  • Outlier Detection
  • Recommendation
  • Natural Language Processing
  • Neural Networks

1. Apache SPARK MLlib 

2. Deeplearning4j - http://deeplearning4j.org
  • One of the top ML Libraries in Java
  • Integrates with Hadoop, Spark
  • Use Cases
    • Face/image recognition
    • Voice search
    • Speech-to-text (transcription)
    • Spam filtering (anomaly detection)
    • E-commerce fraud detection
    • Regression 


3. Apache Mahout - http://mahout.apache.org
  • Runs on Hadoop Cluster, so infinite scalability
  • Good for recommendations

5. Google Prediction APIs (as service) - https://cloud.google.com/prediction

Types of the problems where you may see few ready examples 
  • Classification
  • Regression 
Google Prediction provides two types of APIs - one that leverages the hosted models and the rest where you have to train the model with you sufficient and then expect the APIs to predict.


5. IBM Watson + AlchemyAPI (as service) - http://www.ibm.com/smarterplanet/us/en/ibmwatson


You can try Alchemy APIs at http://www.alchemyapi.com/products/demo . One of the newest and a very significant acquisition by IBM is Alchemy API. Here are the two primary offerings from Alchemy API -
  • AlchemyLanguage - Text Analytics and Natural Language Processing.
  • AlchemyVision - Leverages deep learning for photo and image processing.
Easy to get registered and get started.


6. MS Machine Learning (as service) - http://azure.microsoft.com/en-in/services/machine-learning

Microsoft has done big deal around coming up with an intuitive UI where users can create a model, train it and run the analytics - all in drag and drops. For a new user it would take sometime to get accustomed to the various UI controls and how Application works. Developers can create her own model and sell it in Azure Marketplace. 

Outlook account works seamlessly. 

7.  Amazon AWS Machine Learning - https://aws.amazon.com/machine-learning 

  • Provides visualisation tools to create ML Models
  • Simple API support for the models generated this way
  • Highly Scalable, can generate billions of predictions in day
8. Weka - http://www.cs.waikato.ac.nz/ml/weka
  • Provides a graphical user interface, command line interface and Java API
  • One of the most popular Java machine learning library
  • Available under GPL License 
9. Mallet - http://mallet.cs.umass.edu
  • Statistical natural language processing, document classification, clustering, topic modeling and information extraction.
10. H2O - http://0xdata.com
  • In-memory data engine
  • Designed for running various types of types of statistical computations (including Deep Learning)
  • Works with Hadoop Distributed File System

Others deserving a mention but could not make it to the list of top 10

JSAT - https://code.google.com/p/java-statistical-analysis-tool
  • Library for quickly getting started with Machine Learning problems
  • Available under GPL 3 but author is open for discussion
  • List of supported algorithms is impressive
  • One man project, done in his free time. Creator is Edward Raff @EdwardRaffML

LensKit - http://lenskit.org
  • Focused on building recommender system, primarily for research based projects
  • Good for trying out. For scale and for production env, one can move to Apache Mahout.
  • Actively developed, managed.
oryx - https://github.com/cloudera/oryx
  • Built on top of Mahout
  • Supports streaming instead of batch jobs, making it realtime
  • Still in early stage. 
Java-ML - http://java-ml.sourceforge.net
  • Provides a collection of algorithms
  • No new release since 2012
Hopefully you will find this short post useful. Leave your feedback and comments.

Connect to me on twitter: @satya_paul

Sunday, January 11, 2015

Did TCS under report employee strength in 2014?

In the wake of recent news on layoffs at TCS, I started looking into TCS Annual reports. As I sifted through the Annual Reports of TCS from last 10 years, something did not seem to be quite right around the employee strength reported in Annual Report in 2014.

Usually, for an IT Services Company the revenue growth is directly proportional to the growth in employee strength, it seemed odd that the Y-O-Y growth rate of Operating Profit was the highest in 2014 whereas the employee growth was the lowest in the history of TCS. So, I started looking into the details of the data based on TCS Annual Reports since 2005.

All the Charts are reproduced courtesy of www.StatsPanda.com

TCS Y-O-Y Key Growth Data (Revenue, Op Margin, Productivity, Avg Salary, Employee Growth)


In 2014, Operating Profit Growth(39.43%) and Productivity Gain(19.57%) were the highest while Employee Growth (8.62%) was the lowest in the history of TCS. That surely raises some eyebrows.
So, I decided to regenerate the same chart by tweaking the Employee Strength from 300,000 (as reported in AR 2014) to 320,000. Now, take a look at the chart below. The numbers look much more realistic - Productivity Gain(12.1%) & Employee Growth (15.86%).

TCS Y-O-Y Data (with Employee Strength as 320,000 as on Mar'2014)


Next, I looked into the Average Salary Increase data and the productivity gain data and tried to see the impact if we change the Employee Strength from 300 K to 320 K at the end of Mar'2014. Check out the generated charts and the analysis below.

TCS Avg Productivity vs Avg Salary when Employee Strength is 300K as on Mar'2014


As per the chart above, TCS Employees received an average salary increase of 14.35% in 2014 vis-a-vis 11.81% in 2013. But little bit of poking with the TCS employees revealed the Average Salary Increase was better in 2012 - 2013 than in 2013 - 2014. Then why do we see a different trend here? Now, take a look at the same chart but regenerated with employee strength as 320 K. You can see the Average Salary increase matches with the data heard from TCS Employees and consistent with the past trend - Average Salary increase changed from 14.35% to 7.21%.  
 
Similar observations can be made with respect to Productivity Gain as well. 19.57% Productivity gain in one financial year is near impossible unless there is fundamental shift in Business Model and Revenue Pattern. With correction of employee strength from 300 K to 320K, even that's get corrected from 19.57% to 12.1%, a much more grounded and realistic number.

TCS Avg Productivity vs Avg Salary when Employee Strength is 320K as on Mar'2014


Last take a look at the Utilization Ratio in the chart below. It has remained range bound over the years and no significant upside can be seen in 2014 w.r.t 2013. So, when there is no significant change in Utilization Ratio & there is a dip in Employee Growth Y-O-Y, how one would explain such a steep growth in Revenue as well Operating Profit level and gain in Productivity gain in 2014?

TCS Key Metrics along with Utilization Ratio

Based on the data and analysis above, it appears TCS did under report their total employee strength at the end on Mar 2014. This observation actually seems to be consistent with the news around layoffs as that's the only way to get rid of off-the-book-employees. So, why did TCS do this?

To show (at least on paper) -

1. Superior growth in productivity number.
2. Higher Average Salary Growth. 

These two are important factors when it comes to valuation. Above par growth in Productivity numbers does indicate superior & improving asset quality, better strategy and execution and that commands higher premium. Higher Average Salary Growth gets reflected in lower attrition as well as increase in ability to attract talent. These factors help de-risk current and future revenue stream. Overall, these numbers are very critical and any change in their values will have impact on the valuation as well. The under reporting does mean that TCS was planning to lay off people in subsequent period. However, this seems to be a reactive step and does indicate the discomfort of TCS Management with the increase in employee strength in higher salary band.

This problem is not going to disappear any time soon. You can expect to see similar waves of employees-in-higher-salary-band continue to keep bothering TCS Management for next few years (basically the hires from 2006 and earlier). The organisation will go through a period of turbulence and may force the management to re-engineer the business model leading to a period of uncertainty for TCS for next few years.

As for the ongoing lay offs this year, there seems to be a sense of urgency and an accelerated pace of reducing the employees at higher salary band. In fact, it's getting uglier now. This could be related to the fact that TCS under reported the employee strength at the end of Mar 2014 and as a result they have to do a catch up job now. So, while superior productivity numbers & better average salary increase made the investors happy & the valuation sky rocketed, it also created a challenge for TCS to handle now. It brought in unnecessary instability to the organisation and increased the risk. TCS needs to handle the employee layoffs more gracefully and better manage the investors' expectations to make the growth story sustainable. Hopefully they report more grounded numbers but closer to reality.

The valuation at current level does seem to be very high and I will not be surprised if we see a correction of 20% in next one to two years time (Rs 1900 - 2100 range).

This article is speculative in nature and a work of subjective interpretation of data available in public domain. I am not a TCS employee and never I was. I don't have any professional relationship with TCS whatsoever and have no share holding of TCS.


You can follow me at @satya_paul 

Tuesday, May 13, 2014

Distributed Datastores - let's take a look under the hood

This one is continuation from my last post where I had looked into various alternative options to traditional RDBMS Databases. In this post I will cover some of the basics and go over the factors that influence the choice of a datastore in general and NoSQL Databases in particular. I will also cover the trade offs associated with a choice of a datastore.

Fundamentally, a Database is a specialized software system that allows you to write/store ( i.e. create, update, delete), read, and even do some amount of processing of the data e.g. executing the aggregate functions.

In a world dominated by RDBMSs, Databases are expected to be ACID compliant, in fact, a must have & an important measure of Quality. This is the case with all the RDBMS and they have been doing that job fairly well for many decades. So, what changed recently? To the core, there are really few handful needs that became very important -
  • Increased Complexity of relationship
  • Need for Flexible Data Structure
  • High Availability
  • Scalability (typically referred as Web Scale) 
Increased Complexity of relationship between entities is handled well by Graph Databases. Typical applications include recommendations, social network etc.

Document Databases do exceedingly well when it comes to supporting Flexible Data Structures. Column Family Databases also provide some amount of flexibility, each row can have a different set of attributes. However, in this post, without getting into further details on those factors, I will shift the focus on last two points and explore how various parameters really influence the choice.

So, how does anyone achieve High Availability (HA) for any system? By building redundancy into the system and databases are no exception, they create replicated failover nodes. Failover nodes are exact replicas of the master node and remains passive unless required. Usually, Databases ensure HA but the challenge of ensuring HA is different when it comes to distributed, partitioned databases. Second, it is one thing ensuring HA against a node or machine failure and it's entirely different thing when it comes to ensuring that at no point DB should be unavailable should there be a Network, Machine, Power or any other failure e.g. Data Center goes down. Typically it is achieved by putting the replicas across different Data Centers spread over different geographies and those replicas are not offline. This is also known as Geographically Distributed High Availability (GDHA). Thus Network Partition tolerance becomes critical. Not all databases support GDHA. Note GDHA is more than Disaster Recovery (DR) where in the replicated nodes remain offline and used only when any disaster hits the master node. Usually the focus of DR Systems is not limited to Databases, they kind of keep the entire stack ready.

Other big issue is really about Scalability. How much a database (read RDBMS) can grow? It can grow as much as the largest machine will allow it to grow. But what if you hit that ceiling too? Obvious answer would be to put a second machine. That's correct, but then can the Database still meet the important quality measure called ACID or can be made highly Available when some of  the operations (i.e. reading, writing or processing of the Data) are happening in distributed systems? A simple answer is NO and that's the time you start looking into trade off matrix. You take a second look into the operations as discrete activities and take a call on what is critical for your business and what you can give up.

Before we go any further lets put the definition of ACID for reference:
  • Atomic: Atomicity refers to the ability of the database to guarantee that either all of the tasks of a transaction are performed or none of them are. 
  • Consistent: The consistency property ensures that the database remains in a consistent state before the start of the transaction and after the transaction is over (whether successful or not).
  • Isolated: Isolation refers to the requirement that other operations/transactions cannot access or see the data in an intermediate state during a transaction.
  • Durable: Durability refers to the guarantee that once the user has been notified of success, the transaction will persist, and not be undone.
Databases achieve these by effective handling of Concurrency i.e. how many person can act or modify the state of the data. Here are the various Concurrency handling mechanisms/options:
  • Lock or Exclusive Lock or Pessimistic Lock. Some databases allow only one user to modify a record, row or document at a time. Preventive.
  • MVCC (multi-version concurrency control) or Optimistic Lock is a mechanism that guarantees consistent reading. It allows multiple users to modify a record with multiple conflicting versions without acquiring an exclusive lock. However, it puts a check when it comes to committing the changes into the database. At that point it allows a successful commit only for the first user to attempt. 
Locks ensure changes are either committed or rolled back in case of a successful transaction and it rolls back everything in case of transaction failure.

Next, lets take a look at Replication i.e. copying the datastore to a different node. High Availability is achieved by replicating a database node. Replication comes in two forms:
  • Master-slave replication makes one node the authoritative copy that handles writes while slaves synchronize with the master and may handle reads.
  • Peer-to-peer/Master-Master replication allows writes to any node; the nodes coordinate to synchronize their copies of the data.
Master-slave replication reduces the chance of update conflicts but peer-to-peer replication avoids loading all writes onto a single point of failure. Other important factor to consider is when data is written on a node, it takes time before it is reflected on all the nodes. You can do it either synchronously or asynchronously for a particular transaction. Your choice will determine whether your database supports Consistency or Eventual Consistency. In case of Peer-to-Peer replication, the same record can be modified by two different transactions on two different nodes. How a databases handles these scenarios is also influenced by the choice of Consistency viz-a-viz Eventual Consistency. There are specific databases that excel in one usecase over the other. I do plan to cover that in my next blog.

While Database replication primarily helps to handle failover and ensures Higher Availability, it also helps Scalability. Master-Slave replication works well for Read Scalability while write operations can take place only on the Master node and Slaves then syncs up with the Master either synchronously or asynchronously. Peer-to-Peer or Master-Master replication helps achieve both Read and Write Scalability as both read and write operations can take place on all the replicas. Here, all the replicas will have the same copy of Database. This is traditionally known as Scaling Up or Vertical Scaling where a Database system can scale as much as a node can grow. This should work well for most of the systems. However, for infinite scale or web scale, one needs to go for Scale out or Horizontal Scaling where data is Partitioned or Sharded across multiple nodes. This allows Databases to grow infinitely just by adding new hardware (usually commodity hardware). Note each partitioned node will have different set of data and may have its own replicas for high availability, each partitioned node is actually a database in it's own capacity.

Scale Up vs Scale Out

Now lets look at the trade off matrix I mentioned earlier in this post. This trade off matrix is known as CAP Theorem. This is also known as Brewer's theorem. It states that it is impossible for a distributed computer system to simultaneously provide all three of the following guarantees:
  • Consistency (all nodes see the same data at the same time). Note this consistency is different than what it is in ACID.
  • Availability (a guarantee that every request receives a response about whether it was successful or failed)
  • Partition tolerance (the system continues to operate despite arbitrary message loss or failure of part of the system)
A distributed system can achieve only two of them at a time.
Here is a nice summary of how different Datastores complies with CAP Theorem from a presentation by Aleksandar Bradic


Finally, here is a matrix, I prepared, to capture various parameters that one would consider while analyzing a Distributed DB System.


Not all values are filled. I will continue to work on this and update it further. 

Connect to me on twitter @satya_paul
Check out my storyboard on www.fanffair.com - http://www.fanffair.com/storyboard/satyajitp2011

Tuesday, April 1, 2014

RDBMS - one size fits all, but not anymore

Relational Databases (RDBMS) have been the de facto standard for storing information for fairly significant period of time, almost since the dawn of the Information Technology Industry. For software developers, traditionally, the obvious choice has been RDBMS and most of us really never gave any serious thought for storing data in any other format. But that's not the case anymore, now the developers are spoilt for choice. In last decade, many new offerings came out of the Labs of Google, Amazon, Facebook, Apache foundation & many niche DB Vendors. They are now mature with proven track records and challenging the dominance of Relation Databases. Yes, I am referring the new generation of Databases i.e. NoSQL Databases (also known as Schemaless Databases), In-memory Data stores and what they call New SQL Databases.

In this post, I will introduce the broad categories of NoSQL databases & various offerings under each category, a brief mention of various drivers behind this movement, cover few use cases where NoSQL databases will score better than the regular RDBMS databases and finally what you give up when you gain so much. What I don't intend to cover here is a detailed technical explanation of key concepts like ACID, BASE, CAP Theorem or details on sharding, partitioning, replication, map-reduce and other associated technological concepts. I do have a plan to cover them in a separate blog post.

Broad Classification of NoSQL Databases

NoSql or Schemaless Databases can broadly be categorized as following:

A key-value store: it's a storage system that stores values indexed by a key. Typically, you can query only by the key and values are opaque and can not be used for querying. This allows very fast read and write operations (a simple disk access) and this model is seen as a kind of non volatile cache (i.e. well suited if you need fast accesses by key to long-lived data). This category of databases are largely inspired by a paper by Amazon based on DynomoDB.


 document-oriented database extends the previous model and values are stored in a structured format (a document, hence the name) that the database can understand. For example, a document could be a blog post and the comments and the tags stored in a denormalized way. Since the data are transparent, the store can do more work (like indexing fields of the document) and you're not limited to query only by key. IBM's Lotus Notes Database has largely influenced this category of databases.  

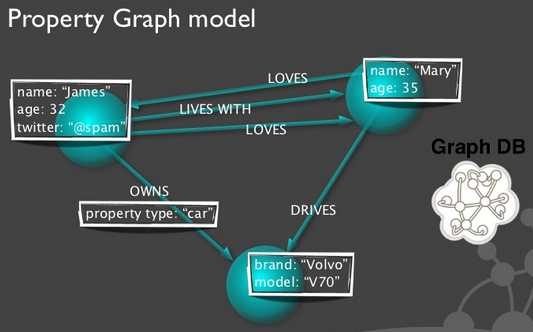
A graph database is a database that uses graph structures with nodes, edges, and properties to represent and store data. A graph database is any storage system that provides index-free adjacency. This means that every element contains a direct pointer to its adjacent elements and no index lookups are necessary.


Source: Presentation by Emil Eifrem, CEO of neo4j
Wide-Column Stores are derived from Google's BigTable. BigTable is a compressed, high performance, and proprietary data storage system built on Google File System. BigTable maps two arbitrary string values (row key and column key) and timestamp (hence three dimensional mapping) into an associated arbitrary byte array. It is not a relational database and can be better defined as a sparse, distributed multi-dimensional sorted map. BigTable is designed to scale into the petabyte range across hundreds or thousands of machines. Every row can have it's set of columns.
Paper by Kai Orend

A New SQL Database - Simply put it's Scalable RDBMS.

Note above definitions are summed up from various sources.

Examples of NoSQL Databases 

Here are few examples from each of them, I tried to pick the popular ones from each category.
Key-Value StoresRedis, Riak, DynamoDB, Voldemort
Wide-Column StoresBigTable (Internal to Google, partially available via AppStore), Cassandra, HBase
Document StoresMongoDB, Couchbase, CouchDB, SimpleDB
Graph Databases: Neo4jInfiniteGraph, FlockDB

Although the following lists are not part of NoSQL family but they are still very relevant and significant, hence mentioning few examples -

In-Memory Stores (Key-Value)memcached, Ehcache

New SQL Databases: VoltDB, Amazon RDS, NuoDB, MySQL Cluster, Clustrix

And for old time's sake -

Relational Databases: Maria DB, MySQL, Microsoft-SQL, IBM DB2, Oracle.

As you see the list is pretty long and at times, it may be slightly confusing as well. In the lists above, the products are grouped under a specific category based on what they claim or their dominant characteristics. But there could be instances where some of the offerings may overlap into two different categories.

Here is nice infographics grouping different offerings under different categories published by Matthew Aslett in his blog.


Usecases and Drivers behind the adoption of NoSQL Databases

Here are few drivers and usecases that drove the adoption of NoSQL databases.

Scalability: With the advent of consumer Internet and massive penetration on mobile devices, scalability challenges increased exponentially. Answer to this challenge was to go for Scale-out architecture (horizontal scaling) over Scale-up (vertical scaling). Traditional RDBMS offerings either failed to adopt the scale-out architecture or they became too complex to manage at that scale. NoSQL databases, particularly Key-Value Pair Databases and Wide Column Stores or Column family Databases came to the rescue. Some of the shining examples would include Google's BigTable and others in it's family (e.g. HBase, Cassandra etc), Amzaon's DynamoDB or other key-value stores like Redis, Riak and finally in memory caches like Memcached etc.

Here is a slide from Emil Eifrem's presentation that shows how various types of DBs are stacked up when it comes to scaling etc.


Schemaless Databases: Scalability was one major reason why companies experiencing Web Scale traffic started looking beyond RDMBS, but a large section of developers started adopting NoSQL Databases for their flexibility. Document databases with their ability to store as well as query JSON/BSON data became popular among the developers. It would be a nightmare to store data like Blogposts, Comments, nested comments etc using a traditional RDBMS and more so as those structures keep on changing. Lot of time, particularly in case of configuration data, each record may have different attributes. Using regular RDBMS databases managing such use cases become very messy - typically for a single such record there will be as many name value pairs entries as the number of attributes or one large table with all possible columns and each record will make use of a fraction of those columns. It becomes quite messy in terms of reading, writing and maintainability point of view. However, Document Databases and Wide Column Databases will work just perfect in these usecases. Unlike traditional RDBMS Databases, Schemaless databases keep related information together and avoid joins.

Economics: Third major reason lies in the economics around capacity building. Unlike large enterprises where they can forecast the future capacity requirements as well as have deep pocket to finance the large servers upfront, start-ups really don't know whether they would be successful enough to invest in large servers coupled with the fact that capital is far more scarce resource in the star-up world. So, upfront investment on large servers becomes a very difficult proposition & a huge entry barrier. They really needed a way to add capacity as they move on (& as far as they move on) and without impacting existing services. The architectures proposed by Amazon's Dynamo DB and Google's BigTable came to the relief. Scale-out architecture took over Scale-up architecture enabling companies to add capacity as they need them & allowing them to grow infinitely. This reduced the need for upfront capital requirement and lowered the entry barrier.

Graph Database: Need for Graph databases is distinctly different from others and represents the real world problem as they appear. In real world everything in interconnected either directly or through others. Graph represents all those connected entities as "nodes" and the connections as "relationship". It can help answer questions like "How do I reach New York?" or "How am I connected to Matt?" or "What movie Julie may like to watch?". Traditional databases fail to scale as the relationships become deeper. Large Social Network sites like Facebook, Linkedin, Twitter have their own graph database implementation and there are few commercially available Graph databases for everyone's use. However, Graph databases are not as scalable as other families of NoSQL databases.

One of the points I did not highlight here is "availability", that's really not a point of differentiation anymore rather a point of parity and most of the RDBMS vendors as well as NoSQL databases provide high availability through replication and fail over.

Conclusion

As you start benefiting from some of the NoSQL features, you must be aware of the areas where you have to give up. Here is short list of areas where you may have to do compromises:
  • Accepting Eventual Consistency over transaction level consistency (ACID)
  • Increased Complexity: Organizing data in a way that all related information remain under one sharded node. 
  • Absence of SQL Query (for some of them).
  • Absence of Joins or Aggregate Functions.
  • Slowness of Two Phase Commits (2PC) when data spread over multiple nodes.
  • Any mass update.
So,  it really comes down to the point that no single solution will address every problem we have and neither they are meant for that. But the good point is we have options.

To put the things in perspective, take a look at the projected revenue growth for various categories as per a study done by the 451 group


Connect to me on twitter @satya_paul
Check out my storyboard on www.fanffair.com - http://www.fanffair.com/storyboard/satyajitp2011


Sunday, December 29, 2013

Consumer Need and Data Driving the Next Generation of Technology

A quick look into the evolution of Information Technology tells us how the needs from the focused groups have shaped up the innovation in Information Technology. 1950s saw scientists in the labs coming up with first generation of technology for the scientific research, it was then lapped up by the Defense departments in 1960s for the military needs. In 1970s, very large Corporations started making use of Information Technology, primarily for batch processing, file transfer in electronic format etc. 1980s saw large organizations automating internal processes and running the batch processes on mainframes. With 1990s, medium business started adopting Technology for automation and B2B communication. Starting 1990 computing started entering into the houses. By 1995 with Windows, Microsoft changed the face of personal computing for ever. This fueled the growth of consumer internet during late 1990s and early 2000. By now technology cycles became shorter and things started evolving much faster.

Fast forward to early 2000s, we see the next generation of Technology innovation was primarily driven by end consumer needs , the volume of traffic and the humongous data that was getting generated due to sudden rise in websites and web users.  By early 2010s Smart phone usage started taking over other forms of personal computing. During early 2000s, Google made many path breaking technological innovation (Big Table, distributed file system etc) while trying to handle millions of web searchers. Those technologies in turn set the direction of next generation Technology. Launch of Apple App Store in 2008 can be considered as another landmark event in this phase.

So, it was no more the demands from Business or Defense Depts that were pushing the limits. It was all about consumers and Facebook, Apple, Google and Amazon became the flag bearers.

Amazon, Facebook, Google, Apple -are all very different companies. If one has to take a guess on their primary identity, it would probably look like - Amazon is the seller, Apple is the product guy, Facebook is the marketer and Google helps you sell. While Amazon and Apple sell their produce directly to the end consumers, Facebook and Google are the market exchange where the sellers & marketers get to meet potential buyers and they primarily sell Ad space.

Each of these companies are pushing the limits of traditional Engineering & Technology backed by insight into end consumer needs or by creating end consumer need. They are redefining computing as it existed.

Although they did not start as Technology companies, but today they control the new frontiers of the Technology and pose serious threat to traditional technology vendors. Apple and Google control Mobile App technologies and the ecosystems. Apple along with Google defines the new age computing devices. Facebook leads the API economy and literally owns a parallel Web (45 million Facebook Fan pages vs 350 million websites). Amazon and Google control the new age computing environments - AWS and GCE. Google controls the World wide web.

What distinguishes them from the traditional Technology players like Microsoft, IBM, Oracle, SAP is their control over the data or the content and their strategy to go deeper into that. This leaves the traditional technology vendors with no option but to do a catch up job in the new world order. Of the traditional Tech vendors, Microsoft probably stands the best chance to remain a dominant player in the new world with their Azure and Windows Mobile offerings. Lets take a quick look into their evolution.

Amazon started as an online book seller, diversified to add many new product categories to eventually become the largest eCommerce company (and poses serious threat to traditional brick and mortar merchants like Walmart). Amazon used their early mover's advantage and insight into end consumer need to start doing the backward integration. They identified newer areas that can scale, they moved to e-books then to Audio books. Like Steve Jobs, Jeff Bezos also knew this very well, it is the superior consumer experience that matters the most and the most important piece here is the reader. This enables Amazon to control end-to-end quality and creates an entry barrier that most of the competitors will find difficult to break through. In the whole process, very diligently Amazon built unique capabilities and leverage that to enter into a new market.  Amazon used Technology to drive the cost down and build an impenetrable entry barrier as a Cost Leader. With their strategy of cost leadership and the burgeoning sales, Amazon had their own need to build a Technology infrastructure that can scale, scale and scale.They invested heavily there and made use of the unused capacity to create a new market called "Cloud Computing". Since then Cloud based computing has empowered scores of developers and fueled the next generation of Technology innovation.

If superior product design and engineering was one major factor behind Apple's success the other one was their ability to serve the content for those devices through iTunes. iTunes also created an entry barrier that most of the other players like Sony etc could not break through just by superior product design and Engineering. Apple duplicated the success theory of iPod + iTunes again with iPhone + App Store. iTunes enabled Apple to control the digital entertainment content and App Store helped them control a new form of content "Apps". Apple's Technology Platform for the mobile Apps still leads the pack. Another example of how content and consumer IT shaping the future of technology.

Google's case is more obvious given the fact that they are necessarily the entry point to world wide web and controls what content a web surfer gets to see. With Google+, Gmail, photo sharing and other consumer specific Apps (Google Now, Google Awesome), they are gradually zeroing into every consumer and pretty much knows what a consumer is doing or looking for. Through Android OS and Play Store, Google remained a dominant player in the new world order and created amazing assets for future revenue. With their control over the traditional web coupled with the growth of Android OS and g+, they probably control most of the digital content in the world. Google followed Amazon's footstep to rent out their computing infrastructure through Google Compute Engine. These technology offerings have used Google's need for scale and consumer centric data as their test bed and probably miles ahead in terms of Engineering excellence and tooling as compared to traditional tech vendors. Google's Technology offering spans from back-end computing (what users can not see) to front-end OS, Apps (what users experience) and most probably the strongest of all.

Facebook's case is probably not as obvious as others. But remember, Facebook is probably the strongest when it comes to consumer data and API access to that data. Their control over data is not just limited to consumer data, Facebook hosts more than 45 million Fan pages, these pages are far more dynamic in terms content & updates when compared to regular web. User engagement of each post talks about the quality of the content. Overall there are 200 million+ Fan pages, Groups and Communities in Facebook. API access to those data would be absolutely critical for the future of the Web and Apps. I will not be surprised (in fact I will expect) if Facebook start charging the developers for the API access.

Of rest, Microsoft probably stands the best chance but their access to content and user data is shallow. A lot depends on how their Mobile platform does. It also depends on how Microsoft can make use of other consumer centric offerings like Skype, Outlook email, Bing Search, Xbox, Zune and the most important their App Store. Microsoft is still the single biggest entity when it comes to desktop computing and owns MS Office. A clear focus and tight integration among them would be critical for MS's success and to remain relevant.

It's evident that Google, Amazon, Apple, Facebook are going to control the world of technology for foreseeable future and Microsoft stands a good chance as well.

So, what's next? What else is seen on the horizon? Well, the answer is - no one knows. However, if I have to take a shot, here is what I think is going happen in next few years.

A critical & big changing pattern is really around smarter tools - development as well as runtime environments and how accessible they have become to the developers. AWS, Azure, Rackspace, and GCE have democratized the Software development process. Now an individual developer has access to all the resources at pittance. To add to it, the developer happens to be the consumer as well and can relate to consumers need personally. Powered by all the resources of the world, developers are going ahead and developing what they love.

This is very different when compared to traditional enterprise world software development where often developers are clueless about what they are developing adding to the high failure rate of the software projects and leading to higher average cost. That doesn't mean projects don't fail outside the boundary of companies. In fact, there the failure rate is higher, albeit with few distinct differences - there is no one to assume the risks for the developers and when they fail, they fail fast and that helps keep the sunk cost to a lower amount. Second, large part of the software development challenges are not only about the business problem, in fact, it is more about the underlying infrastructure, the architecture & design required to achieve HA, DR, Scalability, Serviceability etc. Now, all these new age cloud based computing environments provide all these things and more at the same place. This has reduced the need for big project management, corporate discipline and the necessity for system, structure and process, usually required for big scale software development.

This empowerment of common developers resulted into development of thousands of consumer focused Apps in last few years. However, earning money in that space has been far more challenging when compared to Enterprise world. So, in coming days we can expect to see some of those developers turning their head towards the Enterprise Software Market and start disrupting the enterprises, industry after industry and some would start challenging the control of large Tech Companies over Enterprise software world with their expertise and all the cool technologies that they have access to.

So, what we would eventually see is very large but limited number Tech Companies providing the computing platform, environment, technology, APIs and large number of independent smart developers to small but agile organizations making use of them but mostly outside the boundaries of intermediate large tech companies.
Follow me @satya_paul


Monday, August 5, 2013

10 Tools that every web developer must know while developing a website


In this post I will cover the tools every web developer or webmaster must know for running a website. These tools & resources will help you to ensure that the users have a superior experience when they visit your website. Superior user experience is not just about the functionality or the cool User Interface, it's more than that. Functionality and UI will help get users for first time but it's the page performance that ensures that users actually spend time or come back again. Next, in case users like your website, how easily and effectively users can share it in their network. In today's world just sharing a url is not sufficient unless it shows the necessary preview info that most of the Social Networks (facebook, linkedin, Google+, twitter et. al) support.

Here are few points that I plan to cover in the rest of the post - 
  • Website Performance & Availability
  • Web Analytics
  • Social Media Sharing
  • Search Engine Optimization
  • Protection of Intellectual Property
1. Website Performance & Availability

There are two aspects of the performance measurement of a website 


a. Number of concurrent users it can support while ensuring an accepted level of response time 
b. Page latency or response time of the page.

Let's spend a minute trying to understand what each of these really means. Support of concurrent users can be interpreted as Throughput without deteriorating the SLA (i.e. Response Time). However, the definition Response Time itself is little fuzzy. First, it's not an absolute number, rather it's a range. Lower range is the time taken to receive the bare-bone HTML content. Once HTML content is loaded in browser's memory, it starts downloading other resources like js, css, images etc. "Page Load time" is the overall time taken to download all the resources that a particular page requires "in order to render it". You can understand it quickly by looking into "Chrome > Right click > Inspect Element > Click 'Network' in the lower panel > Load the website > Observe the results", you can do the same in Firefox as well. Typically the bare bone html is generated in your web server while other static resources are served by the CDN networks.

So, it's important that your webserver is able to scale and serve the base page really fast (~300 ms) even under high load and you make use of a good CDN service that can serve the static content blazing fast.

Coming to the tools, JMeter is a good choice for doing the load testing on the website. In fact, JMeter needs to be used even during the development phase to fix low hanging issues. However, for professional grade results, I will recommend a cloud based solution - LoadImpact. Here is a report generated on www.fanffair.com using loadimpact.com - goo.gl/MQK0R . Note both the tools measure the time taken to load the bare-bone HTML content. Two other tools that you may like to evaluate are - Anturis & Pingdom . They do a good job of monitoring the site performance (along with monitoring availability).


JMeter - http://jmeter.apache.org/
LoadImpact - http://loadimpact.com 

Anturis - https://anturis.com/
Pingdom - https://www.pingdom.com 

Now, how to measure the Page Loading Time or the latency to serve the page i.e. what your users finally experience. Google Page Speed is probably a good starting point to measure, use the service to get an overall score and a report with all the recommendations. Two other tools that would come handy are Chrome Developer Tool and Yahoo! Slow. It will take some time to act on all the recommendations but you will be able to bring noticeable difference in overall page load time by acting on all the recommendations.


Google Page Speed - https://developers.google.com/speed/pagespeed 
Yahoo! Slow - http://developer.yahoo.com/yslow/
Yahoo! Slow Performance rule - http://developer.yahoo.com/performance/rules.html
Chrome Developer Tool - https://developers.google.com/chrome-developer-tool

Next is Availability, it is far more important a factor than Website performance. However, it is probably more basic a problem to solve and most of the Data Centers and Cloud based computing environments (e.g. AWS, GAE, Azure etc) provide a very high rate of availability and today this has become more or less a non-issue. But nonetheless, it's always a good idea that you monitor your website for availability. Better to get an alert from a automated monitor than a user. Both Anturis & Pingdom do a pretty good job on that front as well.

Anturis - https://anturis.com/
Pingdom - https://www.pingdom.com 

Personally I would prefer Anturis over Pingdom.

2. Web Analytics


This is the most important measurement for your website. Based of number of users, usage, location of users, devices used and other demographic info, you may need to alter your website design or the content. Google Analytics is probably the most popular and widely used Web Analytics tool, it's available for free. Few other alternative would include Adobe Marketing Cloud (Omniture) (paid), Core Metrics from IBM(paid).


Google Analytics - http://www.google.com/analytics/
Adobe (Omniture) - http://www.adobe.com/solutions/digital-marketing.html
IBM (Coremetrics) -  http://www-01.ibm.com/software/marketing-solutions/coremetrics/


If your website is registered as a Facebook App then you can benefit a great deal from Facebook App Insight.

Facebook Insights - https://www.facebook.com/insights/
Facebook Insights Documentation -  https://developers.facebook.com/docs/insights/

3. Web Masters tool 

Web Masters tool allows the website owners to submit their websites to the Search engines and configure few other associated parameters. Obviously, of all Google's Web Masters Tool is the most important. However, there are more e.g. Bing's Webmaster's Toolbox

Google - https://www.google.com/webmasters/tools
Microsoft - http://www.bing.com/toolbox/webmaster 

In addition, you may like to submit the website url to various directory listing services 

Open Directory Project - http://www.dmoz.org/

Yahoo! Directory Listings - http://dir.yahoo.com/ 

They still have importance from Search Engine point of view.

4. Chrome Dev tools 

I am calling it out separately as Chrome Dev Tool deserves this. This is probably the one tool that will give you a holistic picture of your website's performance as seen by end users. It helps you to optimize the html, css, javascript, images contents of your website as well as improve the network and rendering performances. It has lot of debugging tools as well. It's a complete solution in itself.

Chrome Dev Tools - https://developers.google.com/chrome-developer-tools

A good alternative would be - https://developer.mozilla.org/en-US/docs/Tools 

5. Cross Browser Support

Testing your website for cross browser support is a long and often a tiring process. In fact, testing your website on multiple browsers across different versions and OS combinations is not going to be a simple task. And with every significant UI change, you need to repeat these testing. It may slow down your development speed as well as your ability to release the new versions significantly. But not any more once you know about these tools - http://browsershots.org 

Browser Shots - http://browsershots.org 
BrowserStack http://www.browserstack.com/


6. Obfuscate/Minify your Javascript

Last thing you want is your competition to copy your javascript code. So, go for obfuscation. Apart from protecting your intellectual property, it also helps you to "minify" (or reduce the size) the javascript content. Here are few -

Closure Complier: http://code.google.com/closure/compiler/
YUI Compressor: http://developer.yahoo.com/yui/compressor/
UglifyJS - http://marijnhaverbeke.nl/uglifyjs 
JSMin by Douglas Crockford - http://www.crockford.com/javascript/jsmin.html

Personally, I liked UglifyJS. 

7. Validate your Open Graph Parameters 

In this age, its important that you understand and ensure that the users & potential users see the right information when a url from your website is shared in popular social media. Managing this preview information is probably as important as your content if not more. This factor may become a make or break point for a website.
Open Graph parameters (Reference: http://ogp.me/) are the meta information about the page (similar to html header info) that goes into every page. Popular social media like Facebook et al, make use of this info to render the preview window when a url is shared.

You can test the OG meta info for a url here - http://developers.facebook.com/tools/debug 

8. SEO 

Search Engine Optimization helps websites to be more searchable and for achieving this, SEO involves implementing certain best practices e.g. setting the meta info of page. SEO is a subject and an industry by itself, here I am not going to cover what is SEO and how it is done. I will leave with certain resources that you may find useful. Webmaster's tools from Google and Bing are the starting points and here are some resources for serious business.

Google - Search Engine Optimization Starter Guide
SEOBook - http://www.seobook.com/ - tons of information available here.
Moz (SEOMoz) - http://moz.com/beginners-guide-to-seo 
Woorank - http://www.woorank.com - Get your website evaluated here and then work on the recommendations.
SEO WORKERS - http://www.seoworkers.com

You can use following two websites for quickly checking backlinks for your website
Majestic SEO - http://www.majesticseo.com
Open Site Explorer - http://www.opensiteexplorer.org


9. Social Media Integration 

Social Media Integration means instrumenting your website so that social sharing becomes easier for the users. A part of it is covered by implementing proper Open Graph parameters for the pages (urls). However, another significant part involves configuring your website for various popular Social Plugins from Facebook, Twitter, Linkedin, Google+, Pinterest etc. Depending on the nature of content and your target audience, you may choose not to integrate all of them but this requires careful thinking before you finalize which plugins should be integrated.

Facebook - http://developers.facebook.com/docs/plugins/ 
Linkedin - http://developer.linkedin.com/plugins
Twitter - https://twitter.com/about/resources/buttons
Google+ - https://developers.google.com/+/web/share/
Pinterest - http://business.pinterest.com/widget-builder/#do_pin_it_button


10. Alexa Account

Finally, as the adage goes, "if you cannot measure it you cannot improve it". Google Analytics gives you a very good insight into how your website is doing with or without all the changes. But that is in isolation, you need to measure how you are doing as compared to your peers and competition. And that's why configuring your web site for Alexa  is very important. 
Alexa measures the overall ranking of the websites based on website traffic. Once your website is configured, you can view the global and country specific ranking for your website. This will enable you to measure how your website is doing in terms of number of visitors and few other parameters and will highlight any change in ranking.

Alexa - http://www.alexa.com/


Although I had started with the plan to cover exactly top 10 tools from different categories but eventually I realized many of the tools are not mutually exclusive and complimentary in nature. So, decided to retain all the important tools and resources. Hope that makes sense.